Showing posts with label Basic Tuning Tools. Show all posts

Sunday, February 23, 2014

Monitoring Tools Overview

 Monitoring Tools Overview

Below are the links where you get lots of Information about Monitoring Tools overview

Enterprise Manager


Statistics and Wait Events

    Statistics are counters of events that happen in the database. These are indicators of the amount of useful work that is being completed. Statistics include counts such as the number of user commits or db file sequential reads. Many statistics have corresponding wait events. There are several statistics that can indicate performance problems that do not have corresponding wait events. The full list of statistics can be found in the V$STATNAME view.

  Wait events are statistics that are incremented by a server process or thread to indicate that it had to wait for an event to complete before being able to continue processing. Wait event data reveals various symptoms of problems that might be affecting performance, such as latch contention, buffer contention, and I/O contention.


  Remember that these are only symptoms of problems, not the actual causes. The full list of wait events can be found in the V$EVENT_NAME view.


  The CLASS column for each statistic contains a number representing one or more statistic classes. The following class numbers are additive:

1, User
2, Redo
4, Enqueue
8, Cache
16, OS
32, Real Application Clusters
64, SQL
128, Debug

For example, a class value of 72 represents a statistic that relates to SQL statements and caching.


Note: Some statistics are populated only if the TIMED_STATISTICS initialization parameter is set to true.

Wait Classes


Statistic Levels

You determine the level of statistic collection on the database by setting the value of the STATISTICS_LEVEL parameter. The values for this parameter are:
  • BASIC: No advisory or other statistical data is collected. You can manually set other statistic collection parameters such as TIMED_STATISTICS and DB_CACHE_ADVICE. Many of the statistics required for a performance baseline are not collected. Oracle strongly recommends that you do not disable statistic gathering. 
  • TYPICAL: This is the default value. Data is collected for segment-level statistics, timed statistics, and all advisories. The value of other statistic collection parameters is overridden.
  • ALL: Collection is made of all the TYPICAL level data, the timed operating system statistics, and the row source execution statistics. The value of other statistic collection parameters is overridden.

Query V$STATISTICS_LEVEL to determine which other parameters are affected by the STATISTICAL_LEVEL parameter.

 select statistics_name, activation_level 
 from v$statistics_level
 order by 2;

Dynamic Performance Views


  • These views are owned by SYS.
  • Different views are available at different times:
    • The instance has been started.
    • The database is mounted.
    • The database is open.
  • You can query V$FIXED_TABLE to see all the view names.
  • These views are often referred to as “v-dollar views.”
  • Read consistency is not guaranteed on these views because the data is dynamic. No locking mechanism on these views
  • SELECT_CATALOG_ROLE grant is required to allow a user to select the V$ views


Dynamic Performance Views Usage Examples

a.  What are the SQL statements and their associated number of executions where the CPU time consumed is greater than 200,000 microseconds?

    SELECT sql_text, executions
    FROM v$sqlstats
    WHERE cpu_time > 200000;

b.  What sessions logged in from the EDRSR9P1 computer within the last day?

    SQL> SELECT * FROM v$session
    WHERE machine = 'EDRSR9P1' and
    logon_time > SYSDATE - 1;

c.  What are the session IDs of any sessions that are currently holding a lock that is blocking another user, and how long has that lock been held? (block may be 1 or 0; 1 indicates that this session is the blocker.)

    SELECT sid, ctime
    FROM v$lock WHERE block > 0;

Time Model Overview


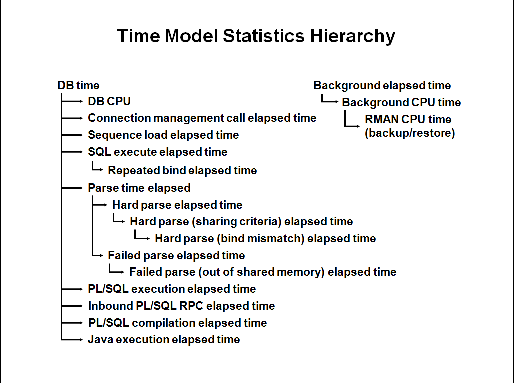
There are many components involved in tuning an Oracle database system and each has its own set of statistics. How can you measure the expected benefit from a tuning action on the overall system? For example, would the overall performance improve if you move memory from the buffer cache to the shared pool? When you look at the system as a whole, time is the only common ruler for comparison across components. In the Oracle database server, most of the advisories report their findings in time. Also statistics called “time model statistics” appear as the V$SYS_TIME_MODEL and V$SESS_TIME_MODEL performance views. This instrumentation helps the Oracle database server to identify quantitative effects on the database operations.

The most important of the time model statistics is DB time. This statistic represents the total time spent in database calls and indicates the total instance workload. It is the sum of the CPU and wait times of all sessions not waiting on idle wait events (non-idle user sessions).

The objective for tuning an Oracle database system could be stated as reducing the time that users spend in performing some action on the database, or simply reducing DB time.

Other time model statistics provide quantitative effects (in time) on specific actions, such as logon operations, hard and soft parses, PL/SQL execution, and Java execution.


DB Time

DB Time = DB Wait Time + DB CPU Time

Tuning is not just about reducing waits. It aims at improving end-user response time and/or minimizing the average resources used by each request.

Sometimes these go together, but in other cases there is a trade-off (for example, with a parallel query). In general, you can say that tuning is the avoidance of consuming or holding resources in a wasteful manner.

Any request to the database is composed of two distinct segments: a wait time (DB wait time) and a service time (DB CPU time). The wait time is the sum of all the waits for various database instance resources. The CPU time is the sum of the time that is spent actually working on the request. These times are not necessarily composed of one wait and one block of CPU time. Often processes will wait a short time for a DB resource and then run briefly on the CPU, and do this repeatedly.

Tuning consists of reducing or eliminating the wait time and reducing the CPU time. This definition applies to any application type, online transaction processing (OLTP) or data warehouse (DW).

Note: A very busy system shows longer DB CPU times and this can inflate other times.

CPU and Wait Time Tuning Dimensions


Top Wait Events


The Top 5 Timed Foreground Wait Events is a good place to start when tuning. 

Tuning Objectives

The objectives of tuning are:

  • Minimizing response time
  • Increasing throughput (Doing more using less resources)
  • Increasing load capabilities
  • Decreasing recovery time


Business requirements affect tuning goals. Performance may be limited by safety concerns, as in the “Decreasing recovery time” goal.

In a business environment where down time may be measured in hundreds or thousands of dollars per minute, the overhead of protecting the instance from failure and reducing recovery time is more important than the user response time.

Performance Tuning Tools

Available tools:

  • Basic: 
    • Time model
    • Top wait events
    • Dynamic performance views and tables
    • Alert log
    • Trace files
    • Enterprise Manager pages
  • Add-in: Statspack --- collect snapshots of statistics
  • Options:
    • Diagnostics pack
    • Tuning pack (requires Diagnostics Pack)


Performance Tuning Diagnostics

Diagnostic tools gather and format the following types of performance data:
  • Cumulative statistics:
    • Wait events with time information
      • The raw counts have little meaning until the counts are compared over time. The events that collect the most time tend to be the most important. 
    • Time model
      • The statistics in Oracle Database 11g are correlated by the use of a time model. The time model statistics are based on a percentage of DB time, giving them a common basis for comparison. 
  • Metrics: Statistic rates /count per unit
    • Metrics provide a basis to proactively monitor performance.
    • You can set thresholds on a metric causing an alert to be generated. For example, you can set thresholds for when the reads per millisecond exceed a previously recorded peak value or when the archive log area is 95% full.  
  • Sampled statistics: Active Session History (allow you to look back in time)
    • Statistics by session
    • Statistics by SQL
    • Statistics by service
    • Other dimensions


How to Tune

The procedures used to tune depend on the tool.
  • Basic tools:
    • Dynamic performance views
    • Statistics
    • Metrics
    • Enterprise Manager pages
  • AWR or Statspack
  • Automatic Database Diagnostic Monitor (ADDM)
  • DBA scripts