
There are many components involved in
tuning an Oracle database system and each has its own set of statistics. How can
you measure the expected benefit from a tuning action on the overall system? For example, would the
overall performance improve if you move memory from the buffer cache to the
shared pool? When you look at the system as a whole, time is the only common
ruler for comparison across components. In the Oracle database server, most of
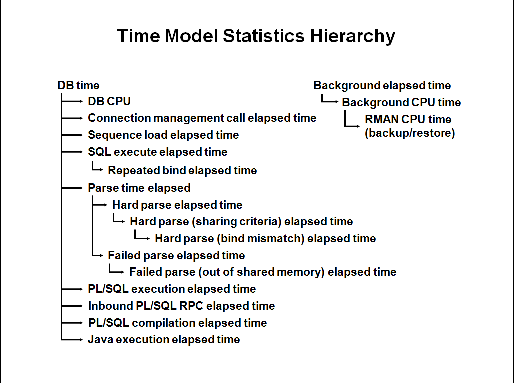
the advisories report their findings in time. Also statistics called “time
model statistics” appear as the V$SYS_TIME_MODEL and V$SESS_TIME_MODEL performance views. This
instrumentation helps the Oracle database server to identify quantitative
effects on the database operations.
The most important of
the time model statistics is DB time. This statistic represents the total
time spent in database calls and indicates the total instance workload. It is
the sum of the CPU and wait times of all sessions not waiting on idle wait
events (non-idle user sessions).
The objective for tuning an Oracle
database system could be stated as reducing the time that users spend in
performing some action on the database, or simply reducing DB time.
Other time model statistics provide
quantitative effects (in time) on specific actions, such as logon operations,
hard and soft parses, PL/SQL execution, and Java execution.

No comments:
Post a Comment